
TIPS #45: Risk Assessment and the Measurement Mirage
Shane Shook
November 17, 2026
- Blog Post
- TIPS

Issue: Risk assessments are only as accurate as their inputs, and most companies measure probability, impact, and compensating controls poorly.
Most cybersecurity risk programs are built on a simple formula: Risk = Probability x Impact. This calculation is at the foundation of risk register heat maps, board reports, and cyber insurance questionnaires, and is the starting point in most major risk assessment standards like NIST’s SP 800-30.
Risk = Probability x Impact
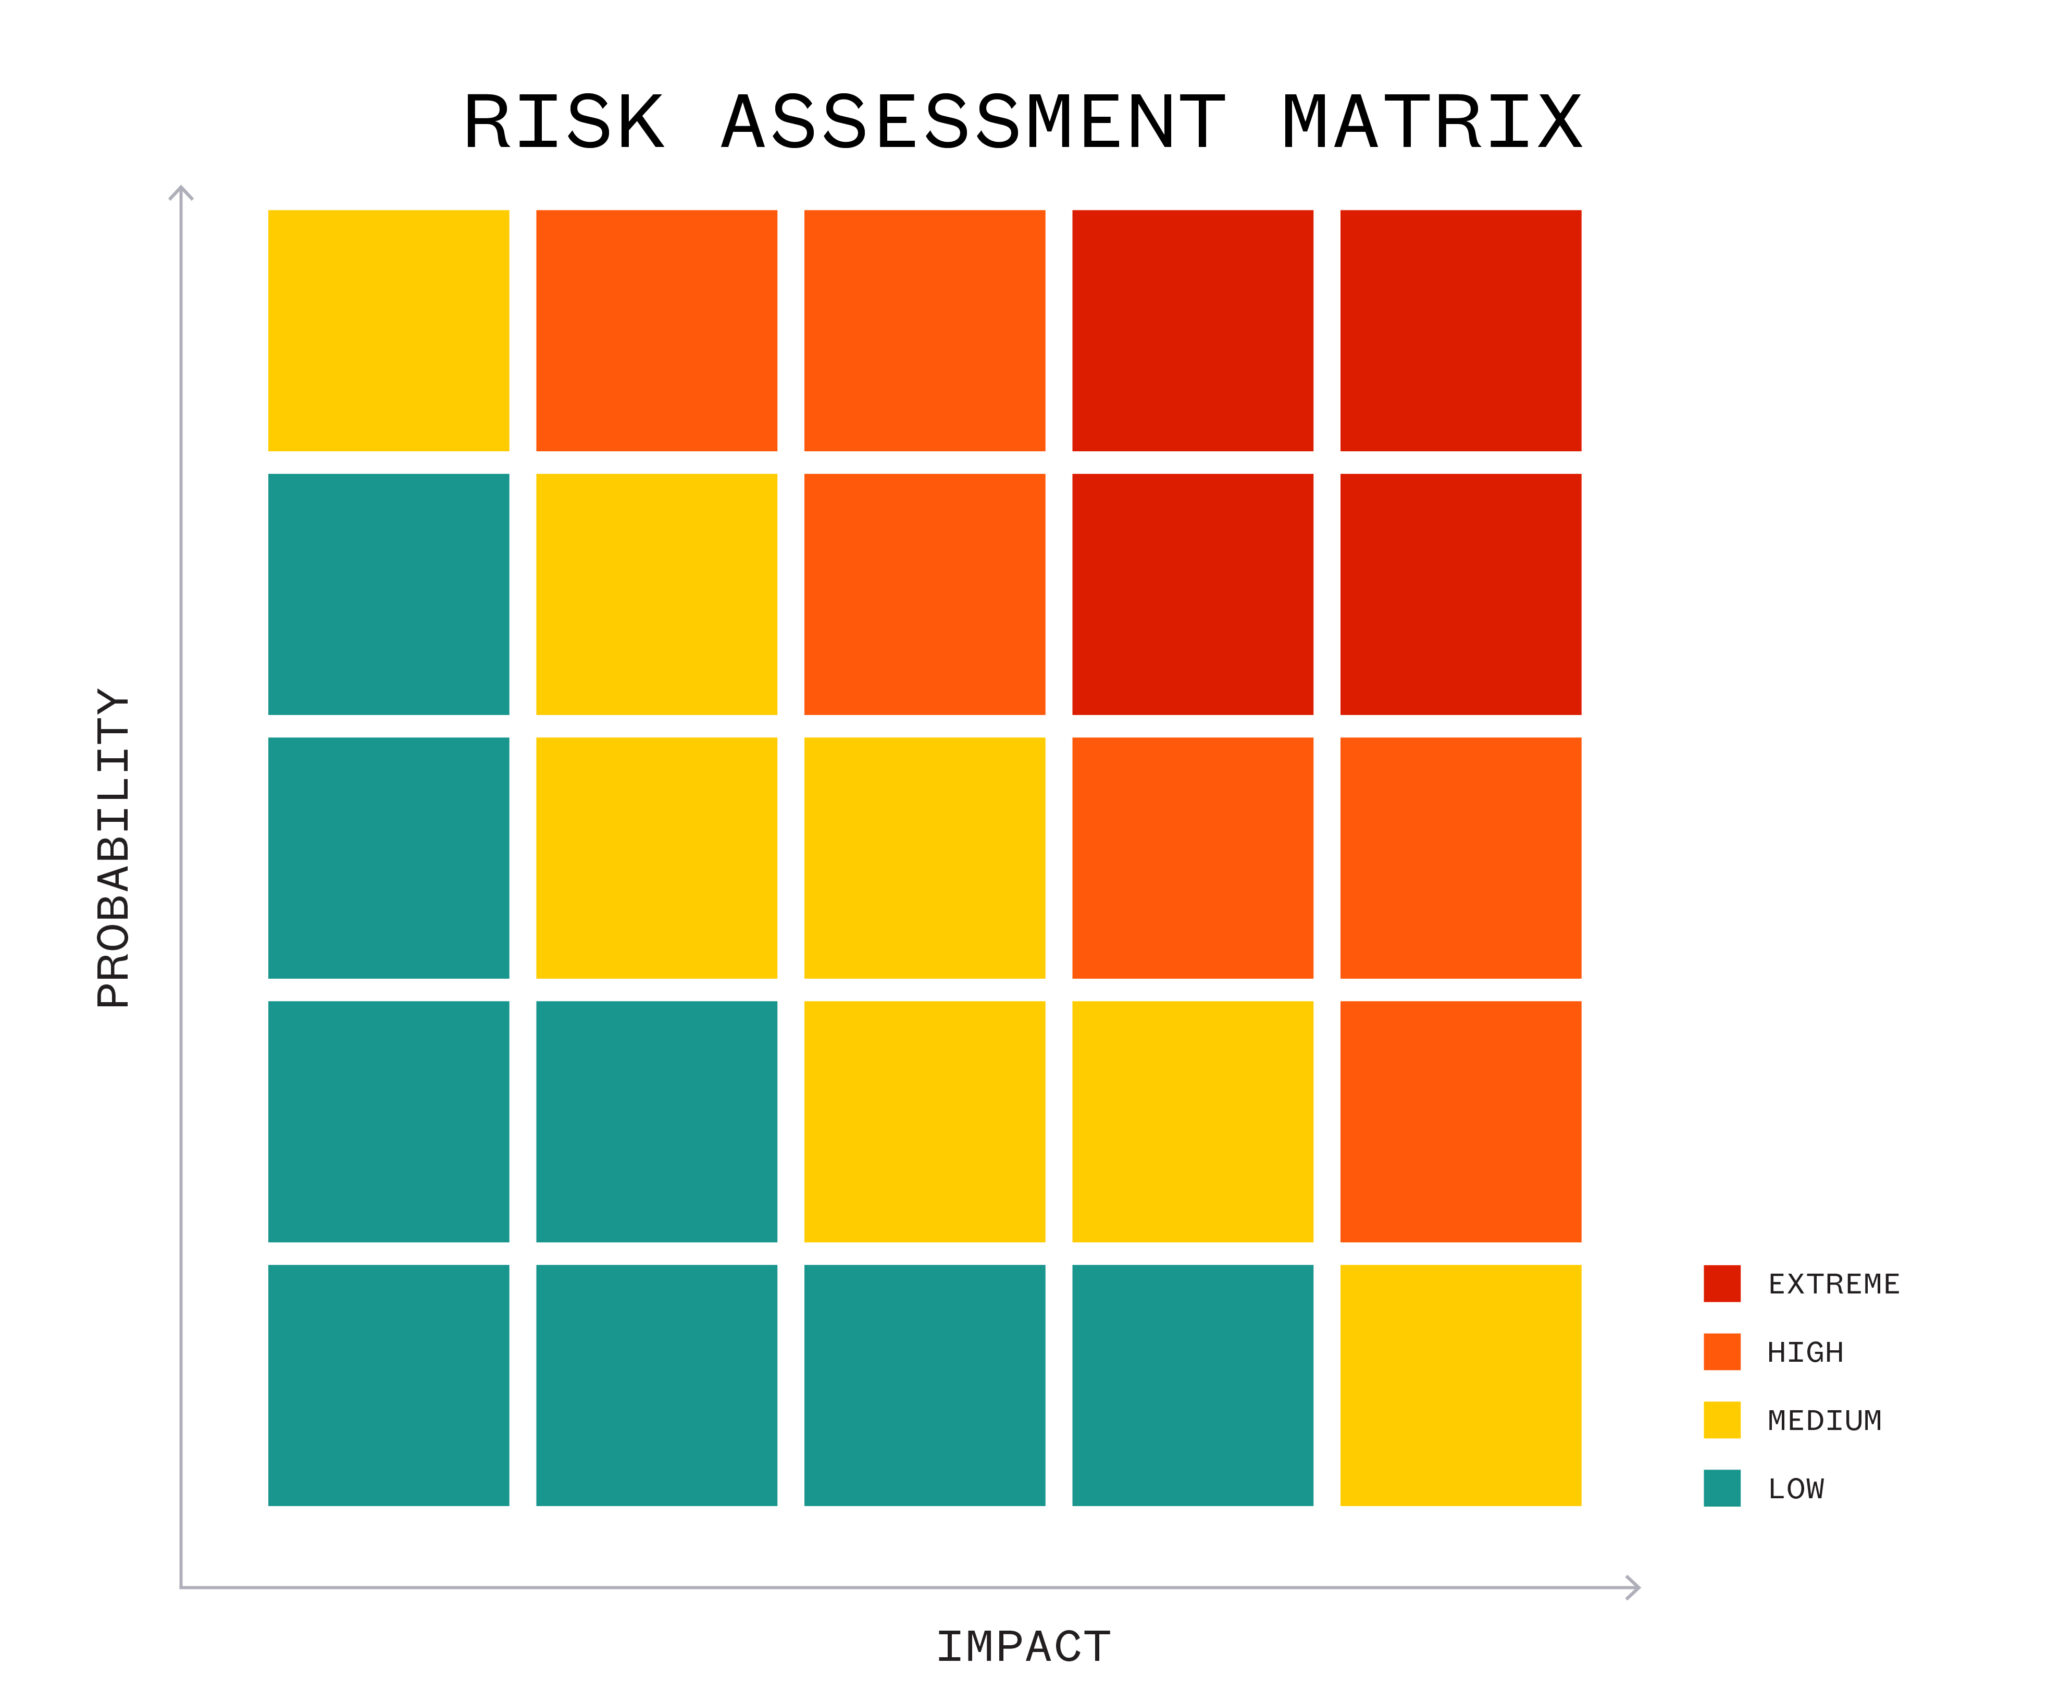
While this approach is useful for ranking threats, it doesn’t account for compensating controls that can reduce risk. Consider a phishing email that steals the credentials of an employee with access to customer data. In an environment without basic controls, probability and impact are both high, so the risk is scored high. In a different environment where MFA is enforced, the workstation is segmented from production, egress traffic is filtered, and customer data is tokenized, the same email is far less likely to escalate to a breach or compromise. However, the traditional Risk = Probability x Impact formula scores both scenarios the same because the phish is just as likely to land and the data is just as valuable.
Information and cybersecurity systems are built on layered defenses- network segmentation, least privilege, conditional access, detection and response, and backups- designed to keep a likely, high-impact event from escalating into damaging breaches and compromises. In TIPS #30, I proposed a revised formula that accounts for these compensating controls:
Risk = (Probability x Impact) / Compensating Controls
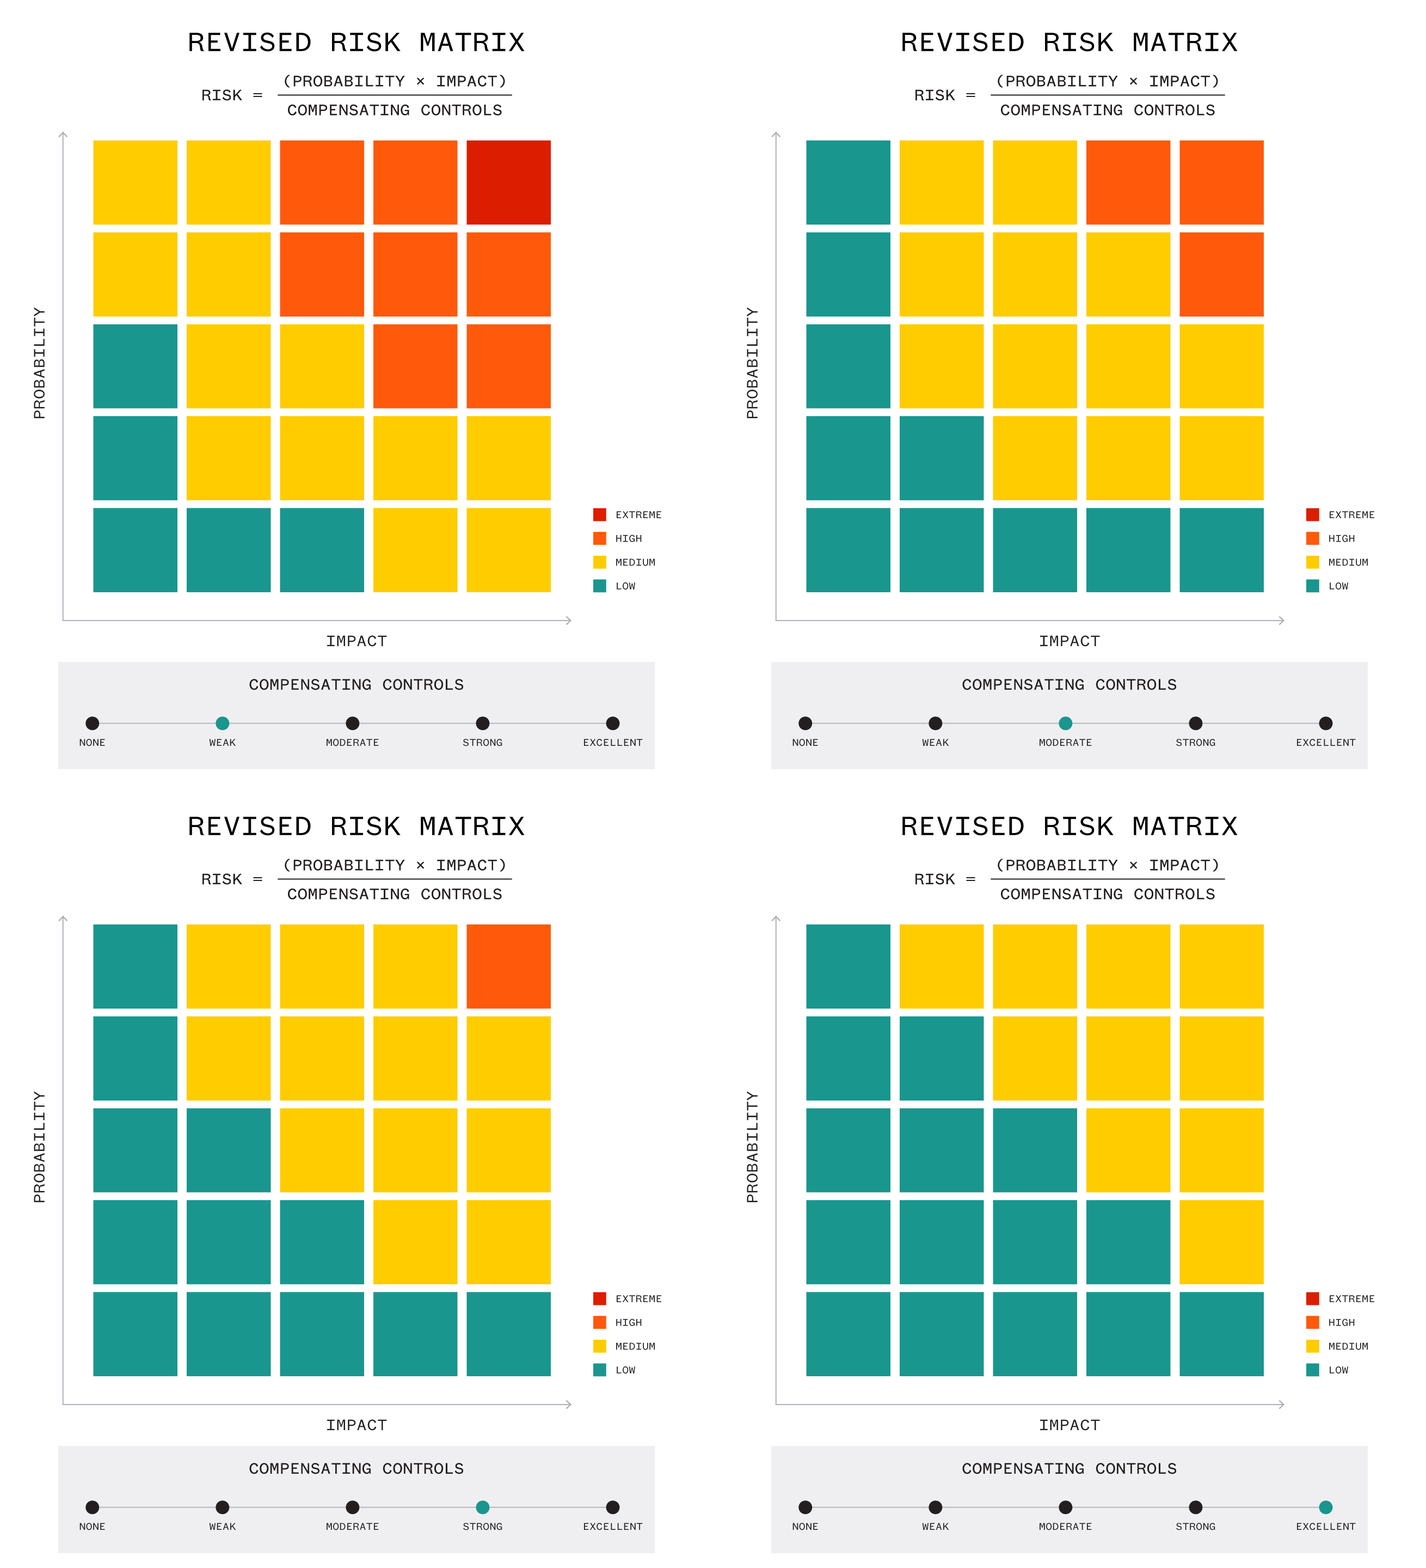
In this revised formula, a weak or unvalidated control increases the real-world value of a risk, while a strong, validated control decreases it.
The measurement problem
However, the revised formula is only as good as how accurately you measure the three variables of probability, impact, and compensating controls. In practice, most companies measure each poorly:
- Probability is typically derived from vulnerability severity scores like CVSS, which blend how exploitable and how damaging a vulnerability is in general, but not whether an attacker can actually reach and exploit it in your environment (see TIPS #44 for a discussion on why CVSS is not a measure of risk).
- Impactis usually assigned to an asset as a static value, as opposed to being based on the blast radius an attacker can reach from the asset and the time they have to reach it.
- Compensating controls are usually measured based on how they are documented for compliance, as opposed to how they are actually deployed- which policies are enabled, which have drifted over time, and how coverage maps to demonstrated TTPs. This is a critical distinction because compensating controls decay and drift over time: they are frequently misconfigured, loosened during incidents and never restored, and purchased but never enabled.
Impact: Companies misevaluate risk and unintentionally create a weak security posture that attackers can exploit.
When companies measure compensating controls, probability, and impact inaccurately, the consequences show up in three places:
- Risk registers prioritize the wrong exposures.A critical CVE on a segmented, monitored host may outrank a medium-severity misconfiguration on an internet-facing portal with reused credentials, even when the portal is the more probable path to a breach in an organization.
- Security spending chases new tools instead of tuning existing ones.If controls are only measured based on whether they were purchased or not, enabling or tuning an existing control doesn’t affect the risk score and is harder to justify, even if it would reduce risk more than a new tool.
- Resilience is misinterpreted.When boards, regulators, and insurers ask how resilient a company is based on documentation, validated defense in depth appears to be the same as “paper controls” that only exist in policies.
The following case studies demonstrate how measurement accuracy impacts risk assessments and incident outcomes, with a focus on compensating controls (two examples where controls did not work and one where they did did)- the variable that separates a contained incident from a reportable breach when probability and impact are high, and the one companies most often credit on paper:
Change Healthcare ransomware breach (2024)
On February 12, 2024, ALPHV/BlackCat affiliates used compromised credentials to log into a Change Healthcare Citrix remote access portal. The attackers moved laterally for nine days before deploying ransomware on February 21. Change Healthcare reported that approximately 192.7 million people were affected. Its parent company UnitedHealth Group ultimately paid a $22 million ransom and faced $872 million in associated costs in Q1 2024 alone.
In congressional testimony, UnitedHealth Group CEO Andrew Witty stated that the company’s policy required MFA on all external-facing systems, but the impacted portal did not have MFA enabled. He also noted that because of Change Healthcare’s legacy technology, its primary and backup environments weren’t isolated, so the attack impacted both and the company had to rebuild its platform from scratch.
In this case, neither the probability nor impact variables were unusual: credential theft against a remote access portal is one of the most common initial access techniques and a clearinghouse processing a large share of U.S. healthcare transactions carries a high impact value. The outcome occurred because Change Healthcare’s compensating controls were unvalidated or absent in key areas: policy-required MFA was not enabled on the attackers’ entry point, lateral movement went undetected for nine days, and the backup environment wasn’t isolated. UnitedHealth was still investigating why the portal lacked MFA when Witty testified in May, more than two months after the attack, which suggests the company had been measuring compensating controls based on its MFA policy, not its actual MFA coverage.
Maersk NotPetya attack (2017)
In June 2017, the NotPetya wiper entered Maersk’s network through a single computer in the company’s Odessa, Ukraine office that was running M.E.Doc, compromised accounting software. Within hours, NotPetya spread across Maersk’s global network and wiped the company’s roughly 150 domain controllers. Maersk’s backup design assumed the domain controllers would sync so that one could restore the rest, but it didn’t account for all of them being destroyed at once; without a clean copy of the directory, nothing else could be restored.
Maersk administrators eventually found a single intact domain controller in Ghana that had been offline due to a local power outage- which Maersk’s security leadership later described as luck– and the company manually reinstalled software on 4,000 servers and 45,000 PCs in ten days. Maersk estimated the incident cost $200 to $300 million in lost revenue, operational costs, and IT spending.
In this case, probability and impact were both extremely high: NotPetya was a self-propagating wiper that spread quickly between and within companies, and Maersk’s global operations depended on one directory. On paper, Maersk’s backup design (a compensating control) reduced risk via a redundant directory with no single point of failure. In reality, it was weaker than documented: every domain controller was reachable by the same self-propagating malware, and the design hadn’t accounted for all controllers going down at once. The only thing that prevented the ten-day outage from being an indefinite one was an isolated, offline copy of a critical system: an unintentional compensating control that mitigated overall risk.
T-Mobile and Salt Typhoon (2024)
In late 2024, Chinese state-sponsored group Salt Typhoon compromised at least nine U.S. telecommunications providers, reaching call detail records and lawful intercept systems in several cases. T-Mobile was among the firms targeted in the campaign. According to the firm’s Chief Security Officer, Jeff Simon, the intrusion attempts originated from a connected wireline provider’s network and the company’s engineers observed the attackers running discovery commands on routers. T-Mobile severed the connection to the wireline provider and says it stopped the attackers from advancing or accessing customer calls, voicemails, or texts.
Simon credited the company’s layered network design- including the separation of systems and networks to hinder lateral movement- along with robust monitoring and a prompt response with preventing the breach of sensitive data. Notably, T-Mobile had recently agreed to implement phishing-resistant MFA and network segmentation under a 2024 Federal Communications Commission (FCC) consent decree following earlier breaches.
In this case, T-Mobile measured its controls the way an attacker would test them, and on an ongoing basis: by its own account, the company ran constant testing and attacker simulations, and its consent decree required a critical asset inventory and independent third-party assessments. When a capable adversary arrived through a trusted third-party connection, the controls it had been testing held up: lateral movement was architecturally constrained, the attacker’s network activity was visible, and the company had the processes in place to act quickly and prevent escalation.
Action: Measure probability, impact, and compensating controls continuously from the attacker’s perspective.
Companies can improve their risk assessment by first adopting Risk = (Probability x Impact) / Compensating Controlsas their working model. Any practical use of this revised risk formula must involve the continuous measurement and validation of all three variables, such that the overall risk score shifts based on changes in the attack surface, containment speed, and compensating control enablement, tuning, or drift. This empowers security teams to determine the appropriate types and levels of compensating controls for risk mitigation.
1) Measure probability by validated exploitability, not vulnerability severity
Probability is a property of the attacker’s chosen path, not just a vulnerability on its own. A critical CVE on a system no attacker can reach has a probability near zero, while a medium-severity misconfiguration on an exposed portal may be the most probable entry point in the environment.
Score probability based on validated reachability and exploitability and refresh it continuously to account for the evolving attack surface. This is more important than ever as attackers use agentic AI to quickly find and chain low-severity exposures into working exploits (as discussed in TIPS #40 and TIPS #44).
Hadrian‘s agentic offensive security platform discovers internet-facing assets, emulates threat actor attack paths, and validates which exposures are exploitable to continuously improve security and close gaps in defenses. Its AI agents are trained by ethical hackers, adjust tactics mid-operation like a human attacker would, and automatically launch new tests the moment the attack surface changes.
“As attackers automate reconnaissance, vulnerability discovery, and exploitation, companies need to think differently. You can’t defend against continuous AI-enabled attacks with quarterly security processes. Instead, use AI to put the attacker’s mindset to work for defenders in your organization.”
 Rogier Fischer CEO and Co-founder, Hadrian
2) Measure impact by reachable blast radius and dwell time, not asset value
Impact is a function of what an attacker can reach from a foothold and how long they have to reach it: the same initial foothold can produce a minor incident if it is contained in minutes and a reportable breach if it runs for days. Companies can reduce both blast radius and dwell time by measuring what a compromised identity or workload can actually access and treating time to investigate and time to contain as impact variables.
Uptycs’ cloud-native application protection (CNAPP) platform normalizes runtime telemetry from the cloud, containers, and endpoints, performing attack path analyses showing which identities a compromised workload can assume, which data stores it can reach, and which lateral paths are open. Its extended detection and response (XDR) capabilities and Juno AI analyst shorten dwell time by detecting threats and scoping which assets are affected, showing the queries and log data behind each conclusion so security teams can verify the results.
“Every security team needs to know how far an attacker could get, and after an incident, how far they actually got. Both are measurement questions, and the answers are only useful if they’re verifiable. Every measurement must trace back to the underlying telemetry.”
 Ganesh Pai CEO and Founder, Uptycs
3) Measure compensating controls based on their deployment, mapped to demonstrated threat actor TTPs
The compensating controls variable is a function of effectiveness: how much of the attack and escalation path your existing controls interrupt, as currently configured. Most companies know which tools they have purchased, but few have a comprehensive view of which policies are enabled, which controls have drifted, and how their security stack maps to demonstrated TTPs. It’s critical to inventory controls based on what they are configured to do and measure coverage for each attack path rather than per tool, and to track controls over time.
Discern Security connects to the security controls a company already owns, establishes a baseline of how each tool is configured, and maps coverage to MITRE ATT&CK, CIS, and NIST frameworks. Its agentic Discern Security Loop reassesses controls continuously, flags coverage gaps and configuration weaknesses as they emerge, and recommends which controls to enable or tune, providing measurable evidence that control effectiveness is improving.
“More security tools don’t necessarily lead to better security. Security teams should measure their existing controls against the threats they face, discover coverage gaps and configuration drift, and optimize what they already own.”
 Sai Venkataraman CEO and Co-founder, Discern Security
4) Put the revised formula to work
Once all three variables are measured from the attacker’s perspective, use the revised formula to guide how your company prioritizes risk, invests in controls, and reports resilience:
- Re-score the top items on your risk register and note what changed. Exposed but well-secured assets will move down in the risk ranking, while poorly controlled assets will move up.
- Fund control enablement and tuning on the same basis as patching and data minimization. If enhancing compensating controls changes the risk score, it may be justifiable.
- Report probability, impact, and compensating controls to the board as three interrelated variables that change over time, rather than a single heat map. Compensating control trends tell the resilience story boards, regulators, and insurers are looking for.
- Re-measure compensating controls on the same cadence as probability: a control that has drifted since its last check will still be credited at full strength, and the associated risk score is understated until this is updated.